4QFY2017 Result Update | IT
May 31, 2017
Tech Mahindra
BUY
CMP
`388
Performance Highlights
Target Price
`533
(` cr)
4QFY17
3QFY17
% chg (QoQ)
4QFY16
% chg (YoY)
Investment Period
12 Months
Net revenue
7,495
7,558
(0.8)
6,884
8.9
EBITDA
899
1,187
(24.3)
1,162
(22.7)
Stock Info
EBITDA margin (%)
12.0
15.7
(371)bps
16.9
(489)bps
Sector
IT
Adj. PAT
588
845
(30.4)
897
(34.5)
Market Cap (` cr)
37,809
Source: Company, Angel Research;
Net Debt (` cr)
(4395)
Tech Mahindra posted muted set of numbers for 4QFY2017. For the quarter,
Beta
1.1
sales came in at US$1,131mn v/s 1,129mn expected, registering a qoq growth of
52 Week High / Low
564/358
1.3%. In Rupee terms, the sales came in at `7,495cr v/s `7,533cr expected, a
Avg. Daily Volume
2,12,936
qoq de-growth of 0.8%. In Constant Currency (CC) terms, the company posted a
Face Value (`)
5
0.9% qoq growth during the quarter. On, the operating front, a 4.2% qoq rise in
BSE Sensex
31,159
the cost of revenues resulted in the EBDITA and EBIT margins coming at 12.0%
Nifty
9,625
and 8.2% v/s 15.5% and 12.2% expected respectively, qoq dip of 371 bps and
Reuters Code
TEML.BO
421 bps. Thus, the Adj. net profit came in at `588cr v/s `741cr expected, qoq
Bloomberg Code
TECHM@IN
dip of 30.4%. We maintain our Buy rating on the stock.
Result highlights: For the quarter, sales came in at US$1,131mn v/s 1,129mn
expected, registering a qoq growth of 1.3%. In Constant Currency (CC) terms, the
Shareholding Pattern (%)
company posted a 0.9% qoq growth during the quarter. In terms of geography,
Promoters
36.2
USA was a major dampener; it constituted 45.1% of sales v/s 46.7% of sales in
MF / Banks / Indian Fls
15.5
3QFY2016; while ROW was the key driver, constituting 25.3% of sales v/s 23.9%
FII / NRIs / OCBs
37.7
of sales in 3QFY2016. On, the operating front, a 4.2% qoq rise in the cost of
Indian Public / Others
10.6
revenues, resulted in the EBDITA and EBIT margins coming at 12.0% and 8.2%
v/s 15.5% and 12.2% expected respectively, qoq dip of 371 bps and 421 bps.
Thus, the Adj. net profit came in at `588cr v/s `741cr expected qoq dip of
Abs.(%)
3m 1yr
3yr
30.4%.
Sensex
8.4
16.6
28.7
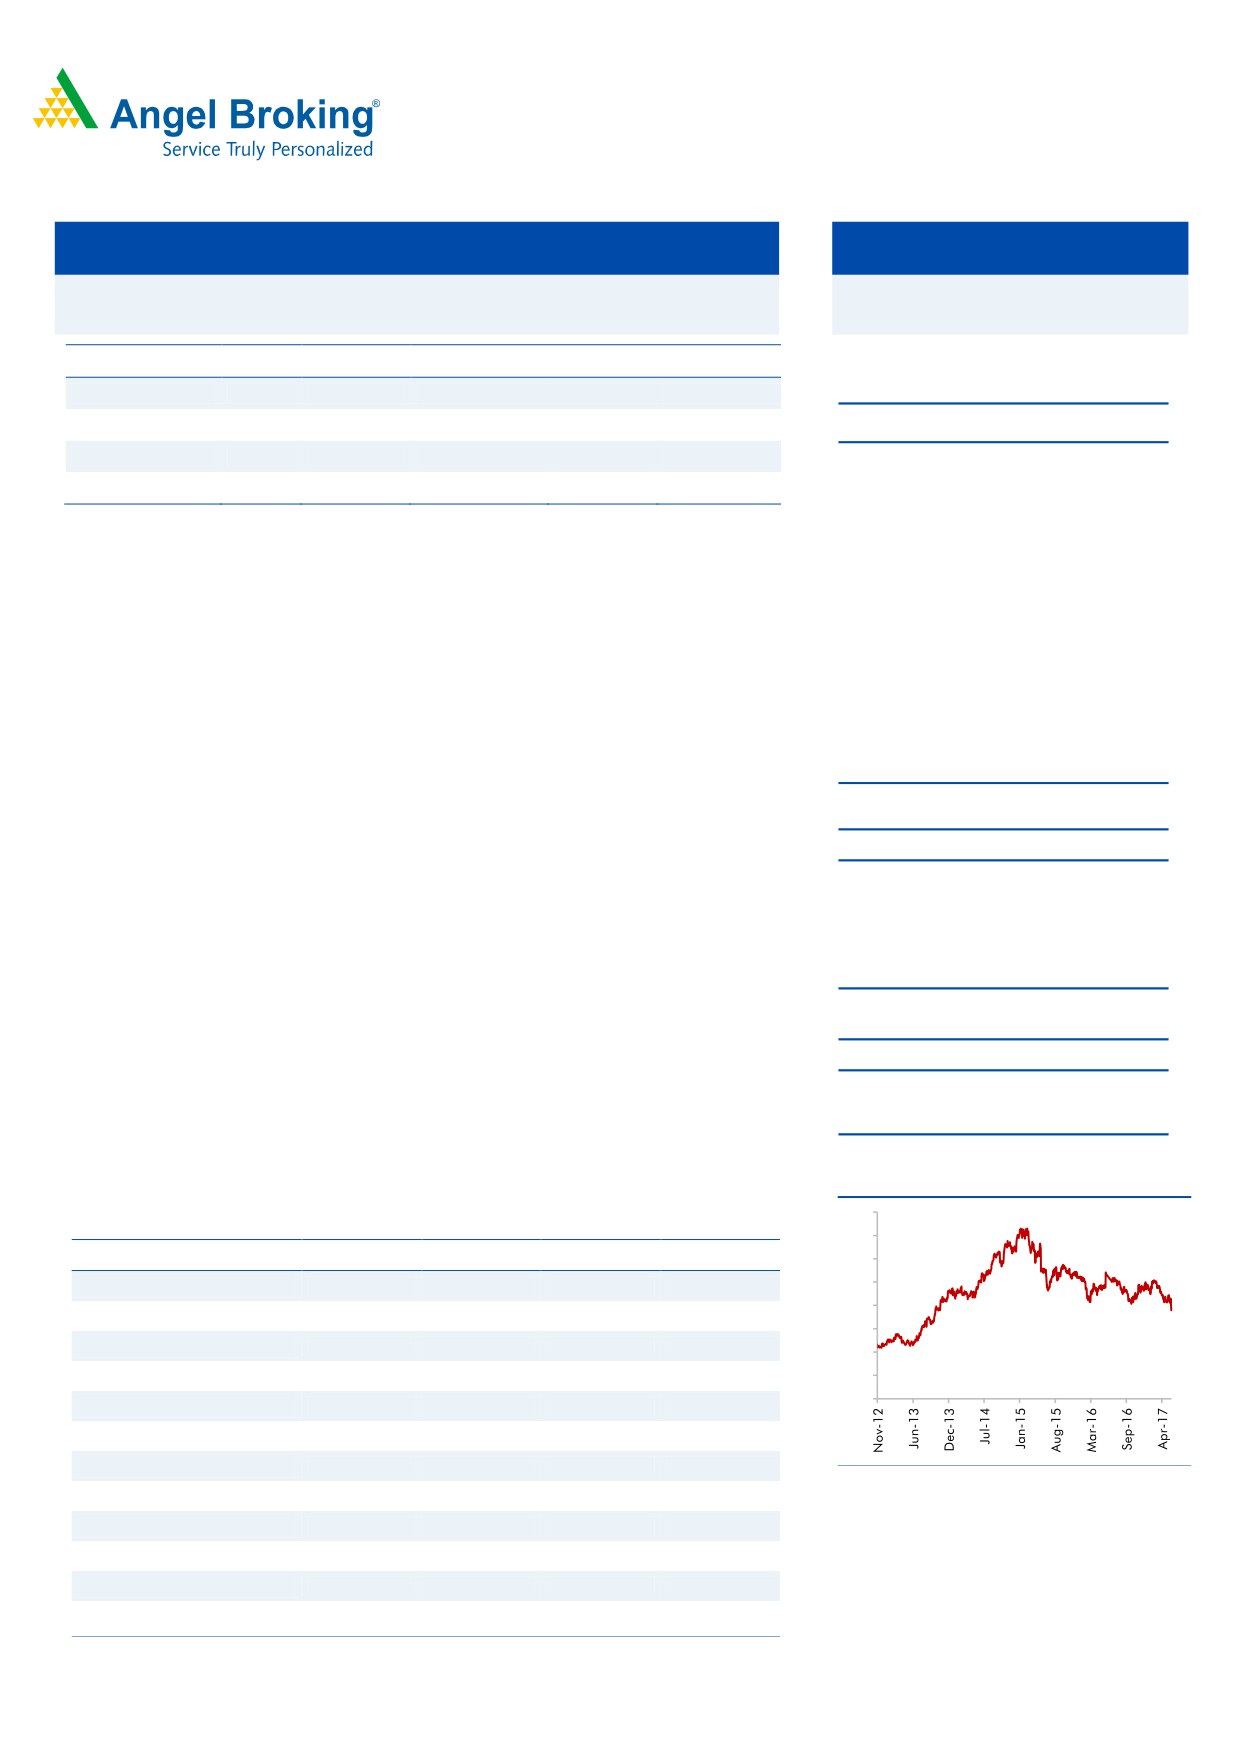
Outlook and valuation: We expect a CAGR of 8.0% and 7.2% in USD and INR
Tech Mahindra
(22.4)
(28.7)
(19.0)
revenue respectively over FY2017-19E. The PAT is expected to grow at a
CAGR of 8.6% over FY2017-19E. We maintain our Buy rating on the stock with
a Target Price of `533.
3-year price chart
800
Key financials (Consolidated, Indian GAAP)
700
Y/E March (` cr)
FY2016
FY2017
FY2018E
FY2019E
600
500
Net sales
26,494
29,141
31,015
33,496
400
% chg
17.1
10.0
6.4
8.0
300
Net profit
3,118
2,813
3,102
3,315
200
% chg
18.7
(9.8)
10.3
6.9
100
0
EBITDA margin (%)
16.3
14.4
15.0
15.0
EPS (`)
35.8
32.3
35.6
38.1
P/E (x)
10.8
12.0
10.9
10.2
Source: Company, Angel Research
P/BV (x)
2.3
2.1
1.9
1.7
RoE (%)
21.4
17.1
17.0
16.3
RoCE (%)
20.1
15.6
16.1
15.9
EV/Sales (x)
1.3
1.2
1.1
1.0
Sarabjit kour Nangra
EV/EBITDA (x)
8.1
8.6
7.6
7.0
+91 22 3935 7800 Ext: 6806
Source: Company, Angel Research; Note: CMP as of May 30, 2017
Please refer to important disclosures at the end of this report
1
Tech Mahindra | 4QFY2017 Result Update
Exhibit 1: 4QFY2017 performance (Consolidated, Indian GAAP)
(` cr)
4QFY17
3QFY17
% chg (qoq)
4QFY16
% chg (yoy)
FY17
FY16
% chg (yoy)
Net revenue
7,558
7,167
5.4
6,701
12.8
21,646
19,611
10.4
Cost of revenue
5,235
4,972
5.3
4,607
13.6
14,103
13,058
8.0
Gross profit
2,322
2,196
5.8
2,094
10.9
7,543
6,553
15.1
SG&A expense
1,136
1,126
0.9
959
18.4
4,258
3,433
24.0
EBITDA
1,187
1,070
10.9
1,135
4.5
3,286
3,120
5.3
Dep. and amortization
248
245
1.3
174
42.5
695
542
28.2
EBIT
939
825
13.7
962
(2.4)
2,591
2,579
0.5
Interest
35
35
1.2
24
99.3
97
63
53.7
Other income
155
139
11.9
64
59.0
540
284
90.0
PBT
1,059
930
13.9
1,002
5.7
3,034
2,800
8.4
Income taxes
214
286
(25.1)
233
12.4
747
638
17.1
PAT
845
644
31.2
769
9.8
2,287
2,162
5.8
Minority interest
0
(0)
-
10
(98.5)
-
1
PAT after minority interest
845
644
31.2
759
11.2
2,285
2,162
5.7
Profit from associates
-
-
-
-
-
Exceptional item
-
-
-
-
-
Reported PAT
845
644
31.2
759
11.2
2,285
2,162
5.7
Adj. PAT
845
645
31.0
759
11.2
2,285
2,162
5.7
Diluted EPS
8.8
6.7
31.0
7.9
11.2
23.8
22.5
5.7
Gross margin (%)
30.7
30.6
9bp
31.2
(52)bps
34.8
33.4
143bp
EBITDA margin (%)
15.7
14.9
77bp
16.9
(124)bps
15.2
15.9
(73)bp
EBIT margin (%)
12.4
11.5
90bp
14.4
(194bps
12.0
13.1
(118)bp
PAT margin (%)
11.3
9.0
233bps
11.3
0bps
10.6
11.0
(47)bp
Source: Company, Angel Research
Exhibit 2: 4QFY2017 - Actual Vs Angel estimates
(` cr)
Actual
Estimate
% Var
Net revenue
7,495
7,533
(0.5)
EBITDA margin (%)
12.0
15.5
350bps
PAT
588
741
(20.6)
Source: Company, Angel Research
Revenue growth led by ROW
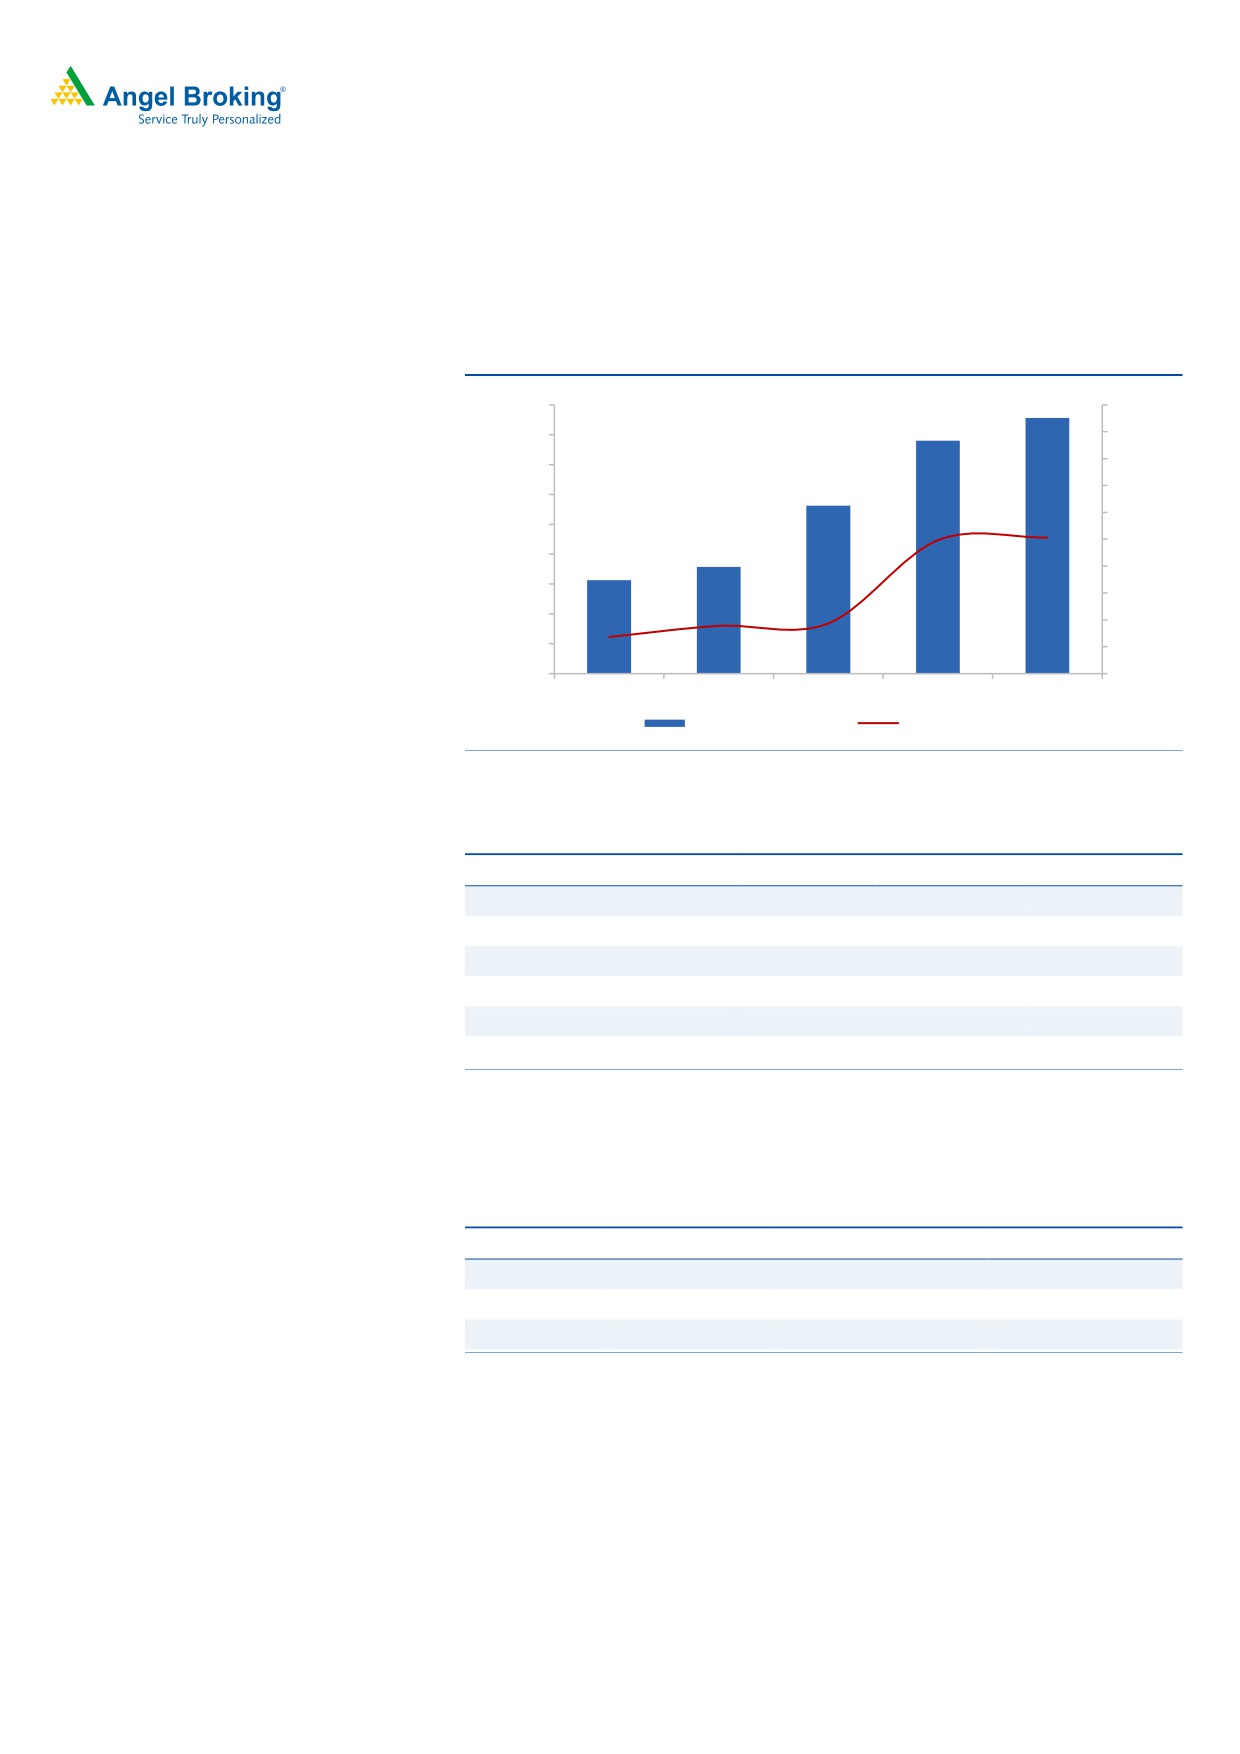
For the quarter, sales came in at US$1,131mn v/s 1,129mn expected, registering
a qoq growth of 1.3%. In Rupee terms, the sales came in at `7,495cr v/s `7,533cr
expected, a qoq de-growth of 0.8%. In Constant Currency (CC) terms, the
company posted a 0.9% qoq growth during the quarter.
In terms of geography, USA was a major dampener, it constituted 45.1% of sales
v/s 46.7% of sales in 3QFY2016 posting a qoq growth of 2.1%; while ROW was
the key driver constituting 25.3% of sales v/s 23.9% of sales in 3QFY2016, posting
a qoq growth of 7.3%. Europe, on the other hand posted a qoq growth of 2.1%.
In terms of the industries, the manufacturing came in at 19.2% of sales v/s
18.4% of sales in 3QFY2016, posting a qoq growth of 5.8%. BFSI was the main
driver, which lead the segment to contribute around 14.1% of sales v/s 13.1% of
sales in 3QFY2016, posting a qoq growth of 9.9%. The key domain i.e. Retail,
Transport & Logistics, posted a qoq de-growth of 13.3%. Also, Technology,
Media & Entertainment, posted a qoq de-growth of 1.8%.
May 30, 2017
2
Tech Mahindra | 4QFY2017 Result Update
Revenue growth during the quarter was a function of strength in the core
Telecom business, planned cut-down of the Network business and unexpected
deferral of VAS products.
Exhibit 3: Trend in revenue growth
4.0%
4.1%
1140.0
9.0%
1120.0
8.0%
7.0%
1100.0
0.9%
6.0%
1080.0
0.8%
5.0%
1060.0
0.4%
4.0%
1040.0
3.0%
1020.0
2.0%
1000.0
1.0%
980.0
0.0%
960.0
-1.0%
4QFY16
1QFY17
2QFY17
3QFY17
4QFY17
Sales ( in US $mn)
qoq (%)
Source: Company, Angel Research
Exhibit 4: Growth in industry segments
Particulars
% to revenue
% growth (QoQ)
% growth (YoY)
Telecom
46.0
0.5
0.6
Manufacturing
19.2
5.8
24.2
TME
6.2
(1.8)
(8.6)
BFSI
14.1
9.1
47.1
RTL
6.5
(13.3)
16.0
Others
7.7
9.9
10.6
Source: Company, Angel Research
In terms of geographies, ROW posted a growth of 7.3% qoq, while Europe and US
posted a growth of 2.1% and (2.1)% qoq respectively.
Exhibit 5: Growth trend in geographies
Particulars
% to revenue
% growth (QoQ)
% growth (YoY)
Americas
45.1
(2.1)
6.6
Europe
29.6
2.1
14.9
RoW
25.3
7.3
13.3
Source: Company, Angel Research
May 30, 2017
3
Tech Mahindra | 4QFY2017 Result Update
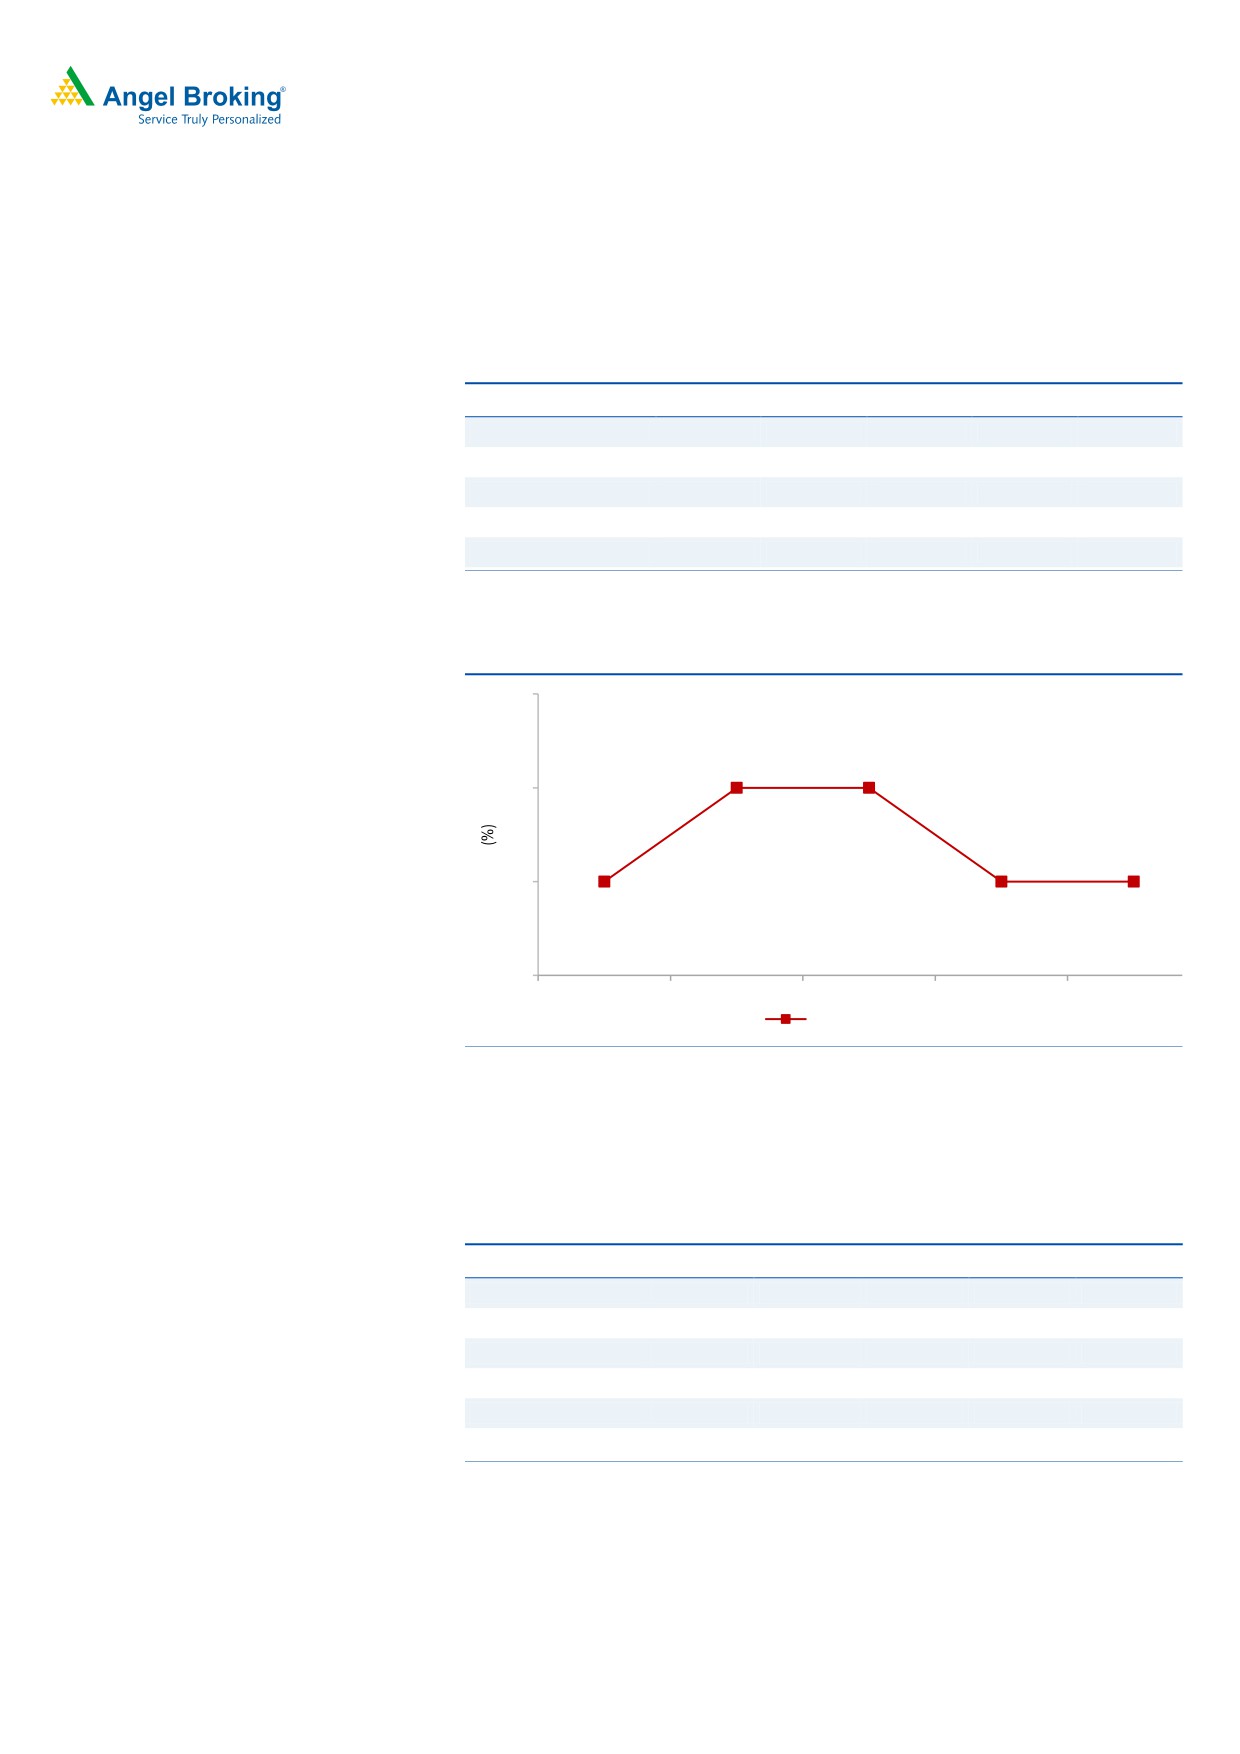
Hiring and client metrics
During the quarter, the company reported a net addition of 598 employees, taking
its overall headcount to 117,693. The BPO headcount currently stands at 28,414
and was the only division to witness additions. Attrition (on LTM basis) was at 17%.
Exhibit 6: Employee metrics
Particulars
4QFY16
1QFY17
2QFY17
3QFY17
4QFY17
Software professionals
72,125
73,590
78,404
80,858
82,403
BPO professionals
27,254
27,326
27,669
29,372
28,414
Sales & support
6,053
6,300
6,813
6,865
6,876
Total employees
105,432
107,216
112,886
117,095
117,693
Attritions (%)
21
21
19
18
17
Source: Company, Angel Research
Exhibit 7: Trend in utilization rate
79
78
78
78
77
77
77
77
76
4QFY16
1QFY17
2QFY17
3QFY17
4QFY17
Utilization (%)
Source: Company, Angel Research
The company added 6 new clients during the quarter, taking the active client base
to 843 (v/s 837 in 3QFY2017), with 8 clients added in US$10mn-20mn+ bracket
and other additions mainly in the US$5mn-10mn+ bracket.
Exhibit 8: Client metrics
Particulars
4QFY16
1QFY17
2QFY17
3QFY17
4QFY17
Total active clients
801
807
818
837
843
US$1mn-5mn
221
207
197
228
220
US$5mn-10mn
42
49
56
63
63
US$10mn-20mn
26
23
22
27
35
US$20mn-50mn
23
26
28
24
22
US$50mn+
14
14
14
14
14
Source: Company, Angel Research
May 30, 2017
4
Tech Mahindra | 4QFY2017 Result Update
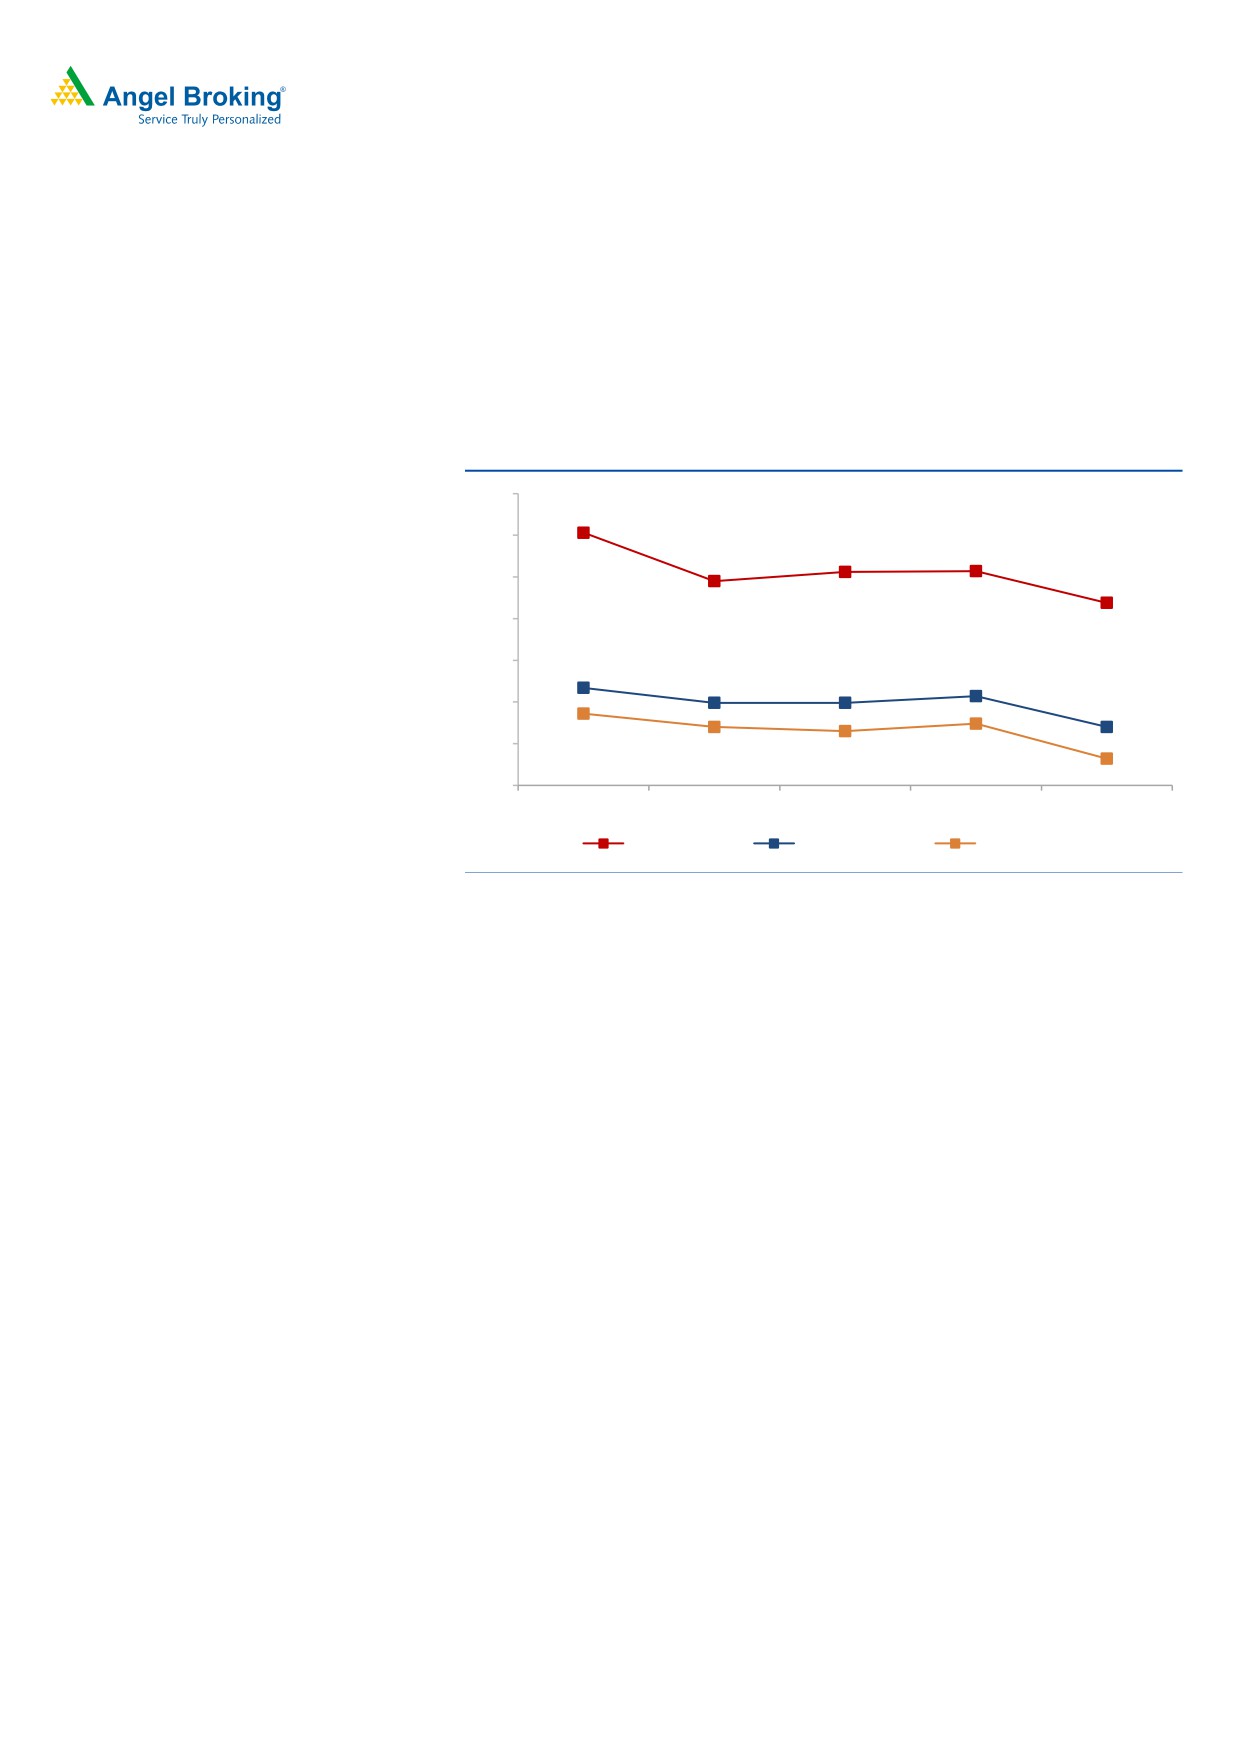
Operating margin dips
On EBIT front, the company posted EBIT of 8.2% (12.2% expected) v/s 12.4% in
3QFY2017. In 4QFY2017, costs included a one-time expense associated with the
restructuring in LCC, impacting margins by 200 bps. This is expected to reverse in
the next quarter. The company was also hit by 150 bps on profitability because of
a pricing reset in a few contracts. This is expected to revive only gradually over the
coming quarters.
Exhibit 9: Margin trend (%)
40
35
35.3
30
30.6
30.7
29.5
25
26.9
20
16.7
15.7
14.9
14.9
15
12.0
10
13.6
12.0
12.4
11.5
5
8.2
4QFY16
1QFY17
2QFY17
3QFY17
4QFY17
Gross margin
EBITDA margin
EBIT margin
Source: Company, Angel Research
Investment arguments
Growth prospects decent: The Management is more optimistic as compared to
what it was at the same time last year. It has also been optimistic about the
prospects of recently acquired entities. On Margin front, the company faces the
usual 1QFY2018 headwinds of visa expenses and Comviva margin contraction.
Any improvement, on the back of synergies and productivity gains will only start
reflecting from 2QFY2018. We expect a CAGR of 8.0% and 7.2% in USD and INR
revenue respectively over FY2017-19E. On EBIT front, we expect the EBIT to be
around 15.0% v/s 14.4% in FY2017.
Inorganic growth initiatives to augment well for company: The company has been
active in the M&A space, with it having acquired Satyam a few years back, to
acquiring LCC and Softgen recently. Softgen’s and LCC’s acquisition was
consolidated in 4QFY2015. LCC is one of the world’s largest independent global
providers of network engineering services to the telecommunications industry with
an estimated annual revenues of more than US$400mn (CY2014) (the effective
run-rate for the business is pruned down to US$200-220mn annualized), with
workforce of over 5,700 network professionals across five continents and more
than 50 countries. With this acquisition, Tech Mahindra will also be addressing a
rapidly growing market opportunity, as telecommunications companies and
enterprises accelerate their network upgrade cycle.
May 30, 2017
5
Tech Mahindra | 4QFY2017 Result Update
Outlook and valuation
Given the recent acquisitions and healthy order pipeline, the company is expected
to post a healthy US$ and INR CAGR of 8.0% and 7.2% respectively over FY2017-
19E. However, the acquisition of LCC will be margin dilutive in the near term,
leading the FY2017 EBDITA margin to drop to 14.4% from 16.3% in FY2016. The
company, given its success in turnaround of its earlier acquisition (Satyam),
believes it would be able to do the same with the recent acquisitions and would be
able to get close to achieving the 20% EBIT levels in future. Given the favorable
valuation on EV/sales front, where it trades at a significant discount to its peers, we
believe the stock should witness uptrend once the profitability returns to its mean
average. We maintain a Buy rating on the stock.
Exhibit 10: Key assumptions
FY2018E
FY2019E
Revenue growth (US$)
8.0
8.0
USD-INR rate (realized)
66.7
66.7
Revenue growth (`)
6.4
8.0
EBITDA margin (%)
15.0
15.0
Tax rate (%)
26.0
26.0
EPS growth (%)
10.3
6.9
Source: Company, Angel Research
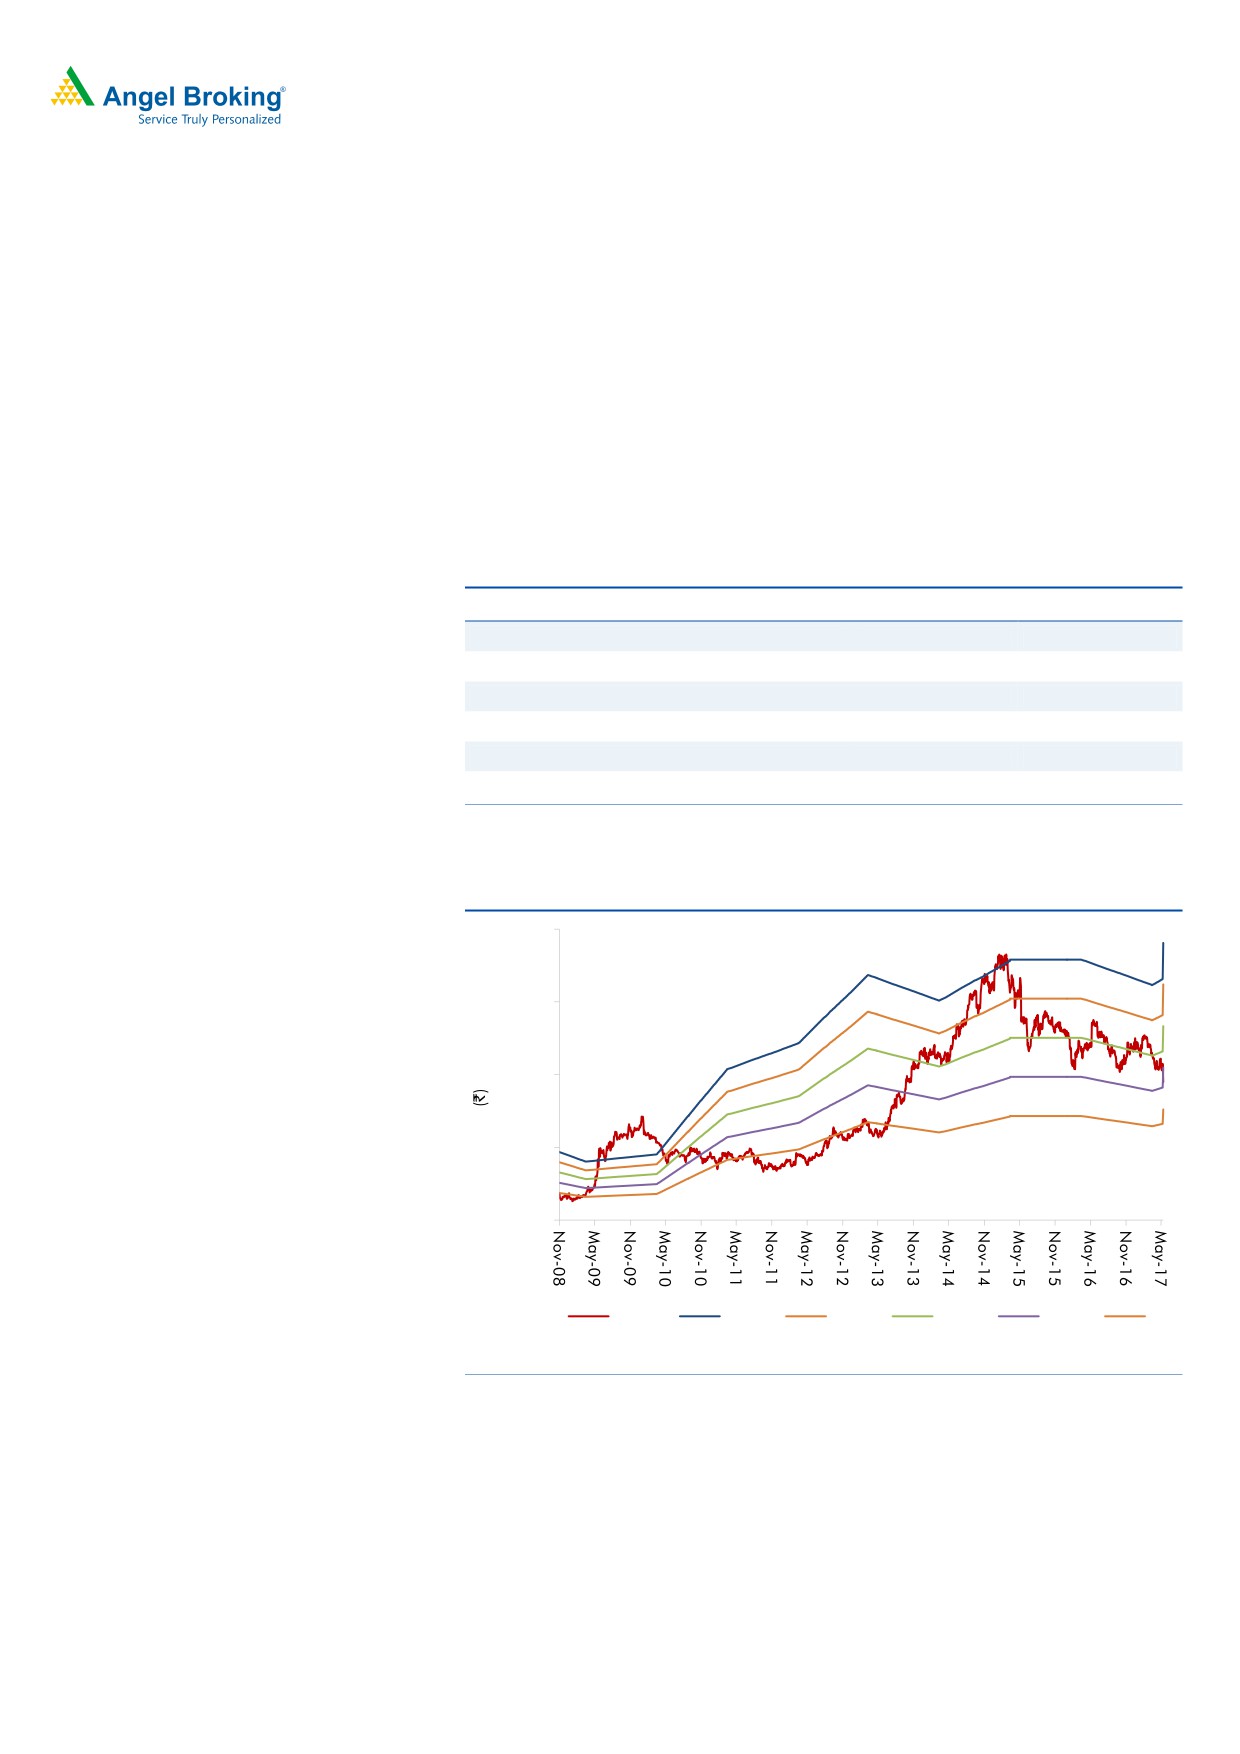
Exhibit 11: One-year forward PE (x)
800
600
400
200
0
Price
20
17
14
11
8
Source: Company, Angel Research. Note: P/E includes profits of Mahindra Satyam from FY2012
May 30, 2017
6
Tech Mahindra | 4QFY2017 Result Update
Exhibit 12: Recommendation summary
Company
Reco
CMP
Tgt Price
Upside
FY2019E
FY2019E
FY2017-19E
FY2019E
FY2019E
(`)
(`)
(%)
EBITDA (%)
P/E (x)
EPS CAGR (%)
EV/Sales (x)
RoE (%)
HCL Tech
Buy
867
1,014
17.0
20.9
12.8
6.2
1.8
20.6
Infosys
Buy
996
1,179
18.3
26.0
14.4
5.3
2.3
19.6
TCS
Neutral
2,552
-
-
27.6
16.4
7.8
3.2
29.8
Tech Mahindra
Buy
388
533
37.4
15.0
10.2
8.6
1.0
16.3
Wipro
Accumulate
535
570
6.5
20.3
14.0
4.4
1.3
13.4
Source: Company, Angel Research.
Company Background
Tech Mahindra was founded in 1986 as a joint venture between Mahindra Group
and British Telecom (BT) to service the latter. Later on, the company started
servicing other external clients as well (solely in the telecom industry). In June
2009, Tech Mahindra acquired a 42.7% stake in erstwhile Satyam Computers
(now Mahindra Satyam) and now the latter is entirely merged with the company.
The company has recently acquired the companies - LCC and Softgen. These two
acquisitions have been consolidated in 4QFY2015. LCC is one of the world’s
largest independent global providers of network engineering services to the
telecommunications industry. LCC is estimated to have annual revenues of more
than US$400mn (CY2014), with workforce of over 5,700 network professionals
across five continents and more than 50 countries.
May 30, 2017
7
Tech Mahindra | 4QFY2017 Result Update
Profit and loss statement (Consolidated, Indian GAAP)
Y/E March (` cr)
FY2015
FY2016
FY2017
FY2018E
FY2019E
Net sales
22,621
26,494
29,141
31,015
33,496
Cost of revenues
15,920
18,323
20,566
21,400
23,112
Gross profit
6,701
8,172
8,575
9,615
10,384
% of net sales
29.6
30.8
29.4
31.0
31.0
SG&A expenses
2,549
3,853
4,390
4,962
5,359
% of net sales
11.3
14.5
15.1
16.0
16.0
EBITDA
4,153
4,318
4,184
4,652
5,024
% of net sales
18.4
16.3
14.4
15.0
15.0
Depreciation and amortization
611
762
978
1054
1139
% of net sales
2.7
2.9
3.4
3.4
3.4
EBIT
3,541
3,556
3,206
3,598
3,886
% of net sales
15.7
13.4
11.0
11.6
11.6
Interest expense
30
96
129
129
129
Other inc., net of forex gain/(loss)
106
557
778
778
778
Profit before tax
3,618
4,017
3,855
4,247
4,535
Provision for tax
960
860
1,002
1,104
1,179
% of PBT
26.5
21.4
26.0
26.0
26.0
PAT
2,659
3,157
2,853
3,143
3,356
Exceptional item
-
-
-
-
-
Minority interest
31
44
40
40
40
Reported PAT
2,628
3,118
2,813
3,102
3,315
Adjusted PAT
2,628
3,118
2,813
3,102
3,315
Fully diluted EPS (`)
30.2
35.8
32.3
35.6
38.1
May 30, 2017
8
Tech Mahindra | 4QFY2017 Result Update
Balance sheet (Consolidated, Indian GAAP)
Y/E March (` cr)
FY2015
FY2016
FY2017
FY2018E
FY2019E
Equity capital
480
436
439
439
439
Preference capital
-
-
-
-
-
Share premium
-
-
-
-
-
Profit and loss
11,768
14,155
15,998
17,823
19,861
Other reserves
0
0
0
-
-
Net worth
12,249
14,591
16,438
18,261
20,300
Secured loans
621
1,002
1,219
1,219
1,219
Unsecured loans
54
-
-
-
-
Total debt
675
1,002
1,219
1,219
1,219
Other long term liability
376
147
537
537
537
Long-term provisions
414
531
620
620
620
Minority interest
160
193
464
504
545
Amount pending investigation
895
1,230
1,230
1,230
1,230
Total capital employed
14,768
17,695
20,508
22,372
24,451
Gross block
7,811
7,973
11,677
12,677
13,677
Accumulated dep.
(3,477)
(4,239)
(5,217)
(6,272)
(7,410)
Net block
4,334
4,364
6,460
6,406
6,267
Capital WIP
266
629
373
373
373
Total fixed assets
4,601
4,993
6,833
6,778
6,640
Investments
2,103
1,243
2,396
4,483
6,736
Long term loans and adv.
1,306
1,895
2,435
2,696
3,117
Interest in TML benefit trust
-
-
-
-
-
Deferred tax asset, net
390
532
267
267
267
Other non-current assets
-
0
0
-
-
Inventories
24
40
61
61
61
Sundry debtors
5,206
5,770
5,338
7,980
7,981
Cash and cash equv.
2,405
4,018
3,219
3,500
4,000
Loans and advances
3,813
4,032
5,518
2,999
3,000
Current investments
-
-
-
-
-
Unbilled revenue
-
-
-
-
-
Sundry creditors
(1,654)
(2,276)
(2,312)
(2,658)
(3,057)
Other liabilities
(1,627)
(2,200)
(2,860)
(3,289)
(3,782)
Provision
(1,799)
(355)
(387)
(445)
(512)
Working capital
6,368
9,031
8,577
8,148
7,691
Total capital deployed
14,768
17,695
20,508
22,372
24,451
May 30, 2017
9
Tech Mahindra | 4QFY2017 Result Update
Cash flow statement (Consolidated, Indian GAAP)
Y/E March (` cr)
FY2015
FY2016
FY2017
FY2018E FY2019E
Pre tax profit from operations
2,659
3,157
2,853
3,143
3,356
Depreciation
611
762
978
1,054
1,139
Exp. (deffered)/written off/others
-
-
-
-
-
Pre tax cash from operations
3,270
3,919
3,831
4,197
4,494
Other income/prior period ad
106
557
778
778
778
Net cash from operations
3,376
4,475
4,609
4,975
5,272
Tax
(960)
(860)
(1,002)
(1,104)
(1,179)
Cash profits
2,417
3,615
3,607
3,871
4,093
(Inc)/dec in
Sundry Debtors
(857)
(565)
433
(2,642)
(1)
Inventories
(15)
(16)
(21)
-
-
Loans and advances
(1,197)
(219)
(1,485)
2,519
(1)
Sundry creditors
105
621
36
347
399
Others
212
573
660
429
493
Net trade working capital
(1,752)
394
(377)
652
890
Cashflow from operating activities
665
4,010
3,230
4,523
4,983
(Inc)/dec in fixed assets
(1,740)
(393)
(1,840)
54
139
(Inc)/dec in investments
(2,067)
860
(1,153)
(2,087)
(2,253)
(Inc)/dec in other non current assets
16
(0)
0
0
-
Cashflow from investing activities
(3,791)
467
(2,992)
(2,033)
(2,114)
Inc/(dec) in debt
(311)
(328)
(217)
-
-
Inc/(dec) in deferred revenue
-
-
-
-
1
Inc/(dec) in equity/premium
1
-
-
0
-
Inc/(dec) in minority interest
(16)
(33)
(271)
(40)
(40)
Dividends
(611)
(1,223)
(917)
(1,278)
(1,277)
Others
1,713
(1,281)
369
(891)
(1,054)
Cashflow from financing activities
775
(2,864)
(1,037)
(2,209)
(2,369)
Cash generated/(utilised)
(2,351)
1,613
(800)
281
500
Cash at start of the year
4,756
2,405
4,018
3,219
3,500
Cash at end of the year
2405
4018
3219
3500
4000
May 30, 2017
10
Tech Mahindra | 4QFY2017 Result Update
Key Ratios
Y/E March
FY2015
FY2016
FY2017
FY2018E
FY2019E
Valuation ratio (x)
P/E (on FDEPS)
12.9
10.8
12.0
10.9
10.2
P/CEPS
10.4
8.7
8.9
8.1
7.6
P/BVPS
2.8
2.3
2.1
1.9
1.7
Dividend yield (%)
1.3
3.1
3.1
3.1
3.4
EV/Sales
1.6
1.3
1.2
1.1
1.0
EV/EBITDA
8.7
8.1
8.6
7.6
7.0
EV/Total assets
7.8
7.0
5.2
5.2
5.3
Per share data (`)
EPS
30.2
35.8
32.3
35.6
38.1
Cash EPS
37.2
44.5
43.5
47.7
51.1
Dividend
5.0
12.0
12.0
12.0
13.0
Book value
140.6
167.5
188.7
209.6
233.0
Dupont analysis
Tax retention ratio (PAT/PBT)
0.7
0.8
0.7
0.7
0.7
Cost of debt (PBT/EBIT)
1.0
1.1
1.2
1.2
1.2
EBIT margin (EBIT/Sales)
0.2
0.1
0.1
0.1
0.1
Asset turnover ratio (Sales/Assets)
4.9
5.3
4.3
4.6
5.0
Leverage ratio (Assets/Equity)
0.4
0.3
0.4
0.4
0.3
Operating ROE (%)
21.5
21.4
17.1
17.0
16.3
Return ratios (%)
RoCE (pre-tax)
24.0
20.1
15.6
16.1
15.9
Angel RoIC
29.3
27.3
19.0
19.4
19.4
RoE
21.5
21.4
17.1
17.0
16.3
Turnover ratios( x)
Asset turnover (fixed assets)
4.9
5.3
4.3
4.6
5.0
Receivables days
92
86
70
97
90
Payable days
29
34
30
32
35
May 30, 2017
11
Tech Mahindra | 4QFY2017 Result Update
Research Team Tel: 022 - 39357800
DISCLAIMER
Angel Broking Private Limited (hereinafter referred to as “Angel”) is a registered Member of National Stock Exchange of India Limited,
Bombay Stock Exchange Limited and Metropolitan Stock Exchange Limited. It is also registered as a Depository Participant with CDSL
and Portfolio Manager with SEBI. It also has registration with AMFI as a Mutual Fund Distributor. Angel Broking Private Limited is a
registered entity with SEBI for Research Analyst in terms of SEBI (Research Analyst) Regulations, 2014 vide registration number
INH000000164. Angel or its associates has not been debarred/ suspended by SEBI or any other regulatory authority for accessing
/dealing in securities Market. Angel or its associates/analyst has not received any compensation / managed or co-managed public
offering of securities of the company covered by Analyst during the past twelve months.
This document is solely for the personal information of the recipient, and must not be singularly used as the basis of any investment
decision. Nothing in this document should be construed as investment or financial advice. Each recipient of this document should
make such investigations as they deem necessary to arrive at an independent evaluation of an investment in the securities of the
companies referred to in this document (including the merits and risks involved), and should consult their own advisors to determine
the merits and risks of such an investment.
Reports based on technical and derivative analysis center on studying charts of a stock's price movement, outstanding positions and
trading volume, as opposed to focusing on a company's fundamentals and, as such, may not match with a report on a company's
fundamentals. Investors are advised to refer the Fundamental and Technical Research Reports available on our website to evaluate the
contrary view, if any.
The information in this document has been printed on the basis of publicly available information, internal data and other reliable
sources believed to be true, but we do not represent that it is accurate or complete and it should not be relied on as such, as this
document is for general guidance only. Angel Broking Pvt. Limited or any of its affiliates/ group companies shall not be in any way
responsible for any loss or damage that may arise to any person from any inadvertent error in the information contained in this report.
Angel Broking Pvt. Limited has not independently verified all the information contained within this document. Accordingly, we cannot
testify, nor make any representation or warranty, express or implied, to the accuracy, contents or data contained within this document.
While Angel Broking Pvt. Limited endeavors to update on a reasonable basis the information discussed in this material, there may be
regulatory, compliance, or other reasons that prevent us from doing so.
This document is being supplied to you solely for your information, and its contents, information or data may not be reproduced,
redistributed or passed on, directly or indirectly.
Neither Angel Broking Pvt. Limited, nor its directors, employees or affiliates shall be liable for any loss or damage that may arise from
or in connection with the use of this information.
Disclosure of Interest Statement
Tech Mahindra
1. Financial interest of research analyst or Angel or his Associate or his relative
No
2. Ownership of 1% or more of the stock by research analyst or Angel or associates or relatives
No
3. Served as an officer, director or employee of the company covered under Research
No
4. Broking relationship with company covered under Research
No
Ratings (Based on expected returns
Buy (> 15%)
Accumulate (5% to 15%)
Neutral (-5 to 5%)
over 12 months investment period):
Reduce (-5% to -15%)
Sell (< -15)
May 30, 2017
12